Reliability is mission assurance
Federal production systems fail in ways that are measured by people who cannot reach benefits, cannot cross a border, cannot file a claim, cannot authenticate to do their job. The cost of downtime is not a revenue miss; it is a citizen waiting. SRE is the discipline that makes federal systems reliable on purpose — with measured service objectives, observable behavior, rehearsed incident response, and release discipline tied to an error budget. The same practices Google articulated for consumer scale apply at least as strongly to federal scale, and the agencies that have adopted them (18F, USDS engagements, VA Lighthouse, CMS quality payment programs) have seen real change in how their systems behave under load.
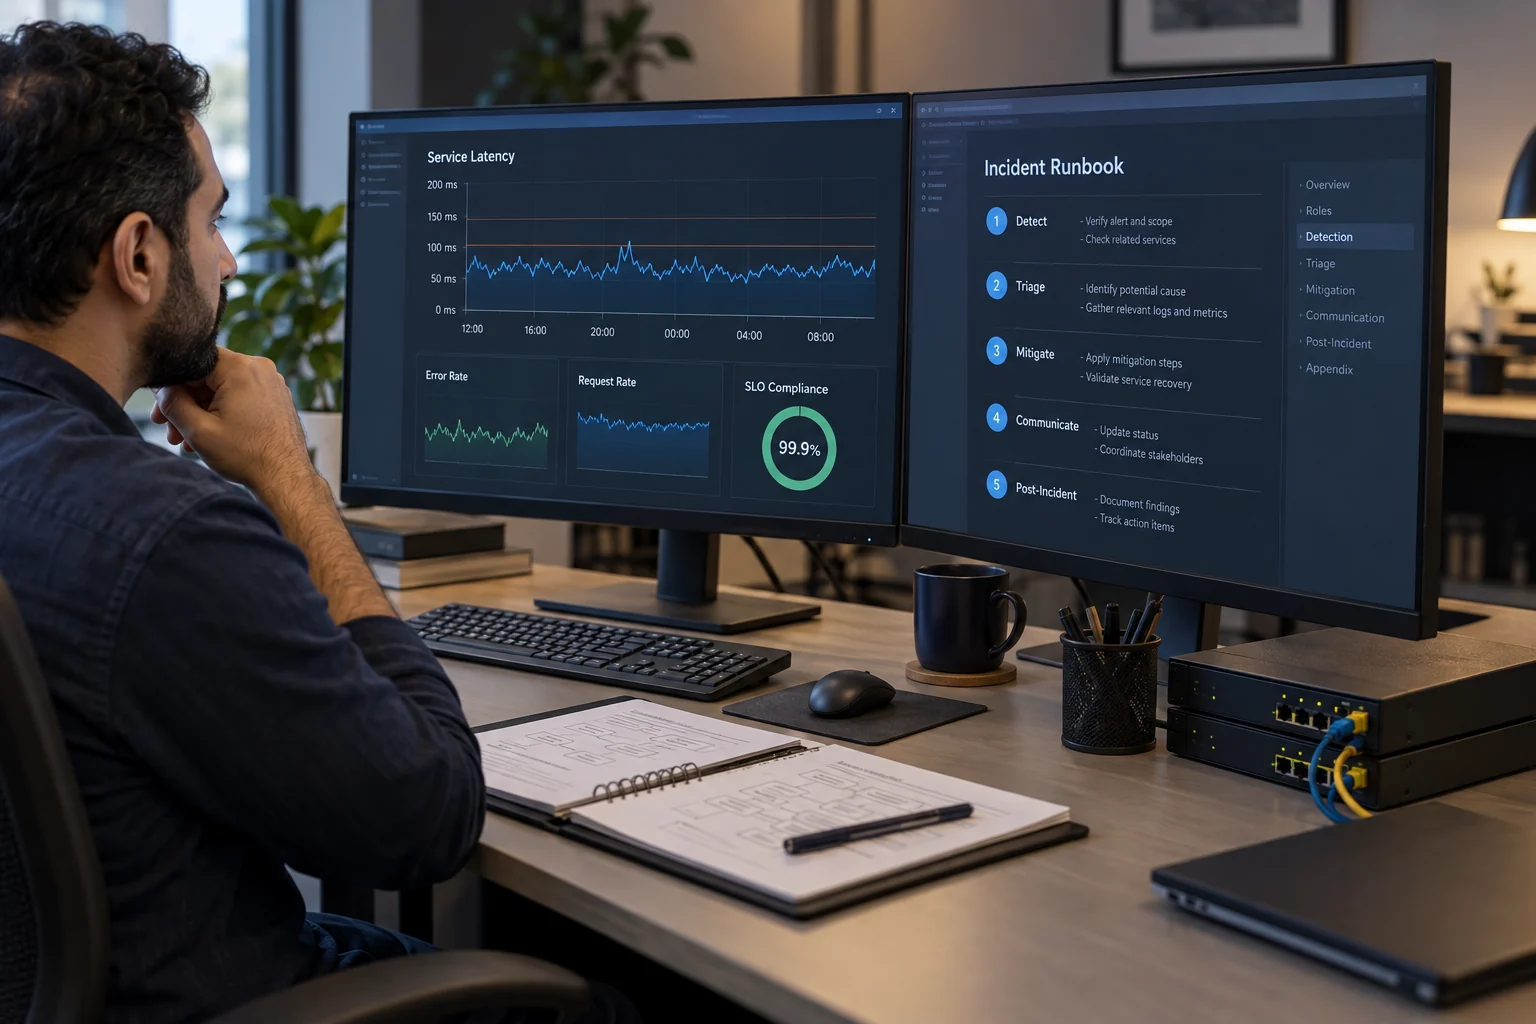
Precision Federal brings practitioner SRE into federal engineering teams. We define SLOs the business owner actually recognizes, stand up observability stacks that live inside the authorization boundary, write runbooks that on-call engineers will actually use at 2am, and build release pipelines that pause themselves when an error budget burns too fast. We pair this with the operational cadence that keeps it working — weekly ops reviews, blameless postmortems, toil audits, and capacity planning tied to the agency's real growth curve.
Why this matters federally: reliability compounds trust. Agencies with reliable systems can modernize faster, ship more often, and ask harder questions of their vendors. Agencies with unreliable systems spend their engineering budget fighting fires.
SITE RELIABILITY ENGINEERING — FEDERAL APPLICATION FIT
The federal SRE stack we use
- Metrics: Prometheus (self-hosted or Amazon Managed Prometheus), VictoriaMetrics, Azure Monitor Managed Prometheus. Long-term storage via Thanos, Cortex, or Mimir.
- Dashboards and alerting: Grafana (self-hosted or AWS Managed Grafana). Alertmanager routing to PagerDuty FedRAMP, Opsgenie, or ServiceNow. SLO dashboards use Sloth or Pyrra for rule generation.
- Logging: Loki, Elasticsearch (self-hosted), Splunk Enterprise (IL5), OpenSearch, Azure Log Analytics. Structured JSON logs with trace IDs; PII stripped at ingest.
- Tracing: OpenTelemetry Collector as the ingest layer, Tempo or Jaeger as the backend, Grafana as the UI. Head and tail sampling configured to keep cost bounded while capturing error traces.
- Synthetic monitoring: Grafana Synthetics, Pingdom Gov, Checkly, CloudWatch Synthetics, Azure Application Insights availability tests. Probes validate critical journeys, not just HTTP 200.
- Incident tooling: PagerDuty, Opsgenie (both with FedRAMP tiers), ServiceNow incident modules, FireHydrant, Rootly. Agency ticketing integration (Remedy, ServiceNow Gov).
- Chaos engineering: AWS Fault Injection Service, Chaos Mesh, Litmus, Gremlin. Experiments run in pre-prod first; production experiments only with mission owner sign-off.
- Capacity: Kubernetes HPA and VPA, Karpenter for node autoscale, application-aware scaling via KEDA. Load forecasts built from the agency's historical traffic plus event calendars (tax season, open enrollment).
- Runbook platforms: runbooks as code in the repo next to the service; rendered via Backstage or MkDocs with deep links from Alertmanager.
SLOs that mean something
Most agency "uptime" metrics measure the wrong thing — whether the health check responded, not whether a user could complete a task. We define SLIs at the journey level: "citizen can submit a claim in under 2 seconds end to end" rather than "load balancer returned 200". Error budgets come out of the SLO target, not the other way around. When the budget burns fast, deploy velocity slows; when the budget is healthy, the team ships. This loop is the only thing we have seen reliably align dev and ops incentives on federal teams.
Federal deployment considerations
- Telemetry inside the boundary: logs, metrics, traces, and alerts flow to sinks inside the ATO boundary. No third-party SaaS that would break the authorization.
- SIEM integration: security-relevant events (auth failures, privilege escalations, config changes) are teed to the agency SIEM — Splunk, Sentinel, Elastic — alongside the engineering observability stack.
- On-call posture: on-call engineers typically need clearance and agency access. Rotation structure respects cleared-US-person requirements for IL5 and above. See IL5 cloud.
- COOP and BCP: SRE owns the Continuity of Operations and Business Continuity test cadence. Multi-region failover exercises, backup restore drills, and tabletop incidents run on the agency's schedule.
- cATO feed: continuous monitoring telemetry feeds the agency's continuous authorization program. See ATO engineering.
Where this fits in Precision Federal engagements
SRE is the operational partner to every other capability. It pairs with Kubernetes, observability, platform engineering, and CI/CD. Typical engagements: stand up an SLO program for a federal production system, replace a brittle Nagios-era monitoring estate with a modern OTel stack, build runbooks for an on-call rotation inheriting a system, or introduce chaos engineering to a mission platform ahead of a major release.